CRISPR-SURF Help
What is CRISPR-SURF?
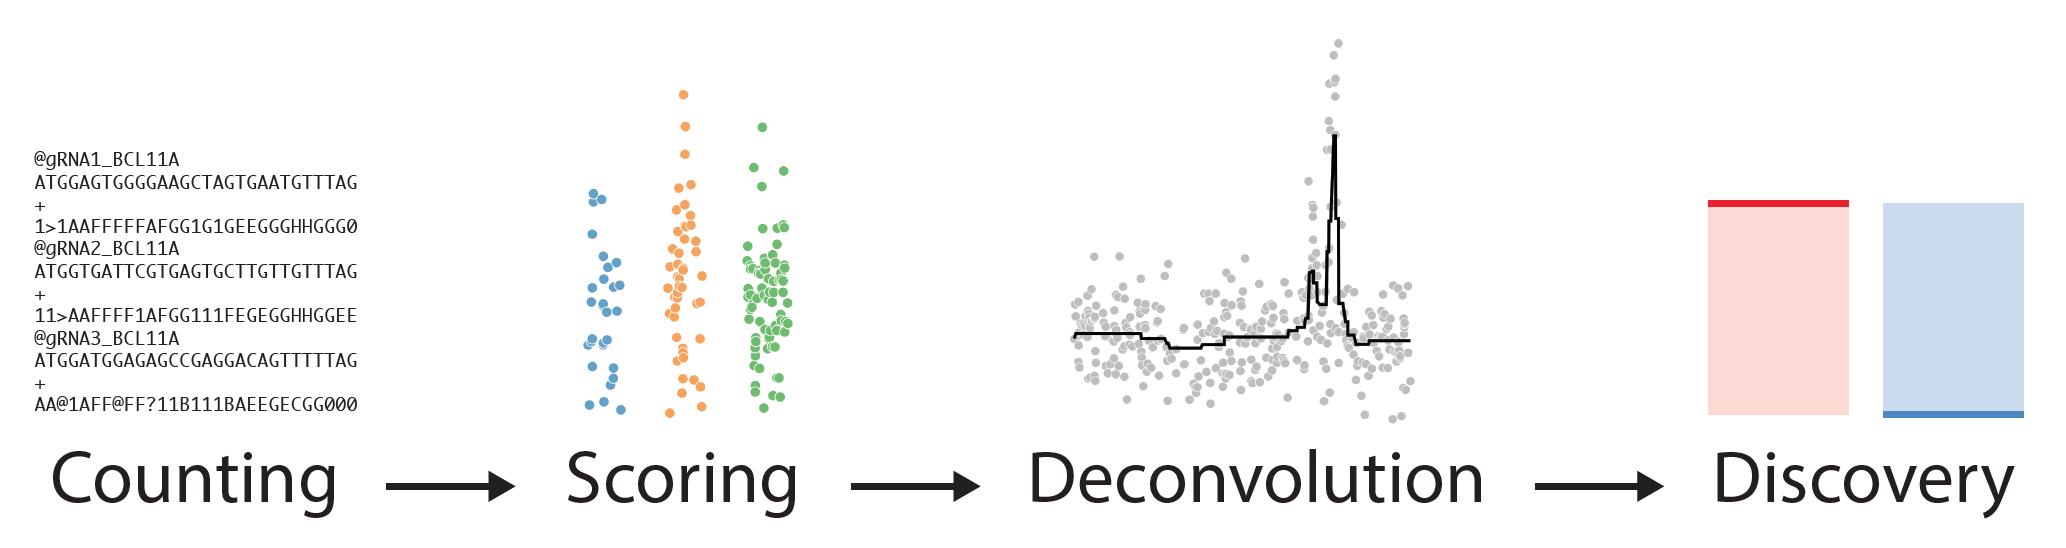
CRISPR-SURF (Screening Uncharacterized Region Function) is a deconvolution framework for the analysis of CRISPR-Cas nuclease, CRISPR interference (CRISPRi), and CRISPR activation (CRISPRa) tiling screen data. Our tool is an open-source software that can be used interactively as a web-application at crisprsurf.pinellolab.org or as a standalone command-line tool with Docker. Please see https://github.com/pinellolab/CRISPR-SURF for details to run CRISPR-SURF locally as a command-line tool or interactive application.
Using CRISPR-SURF
A) Visualize several published datasets
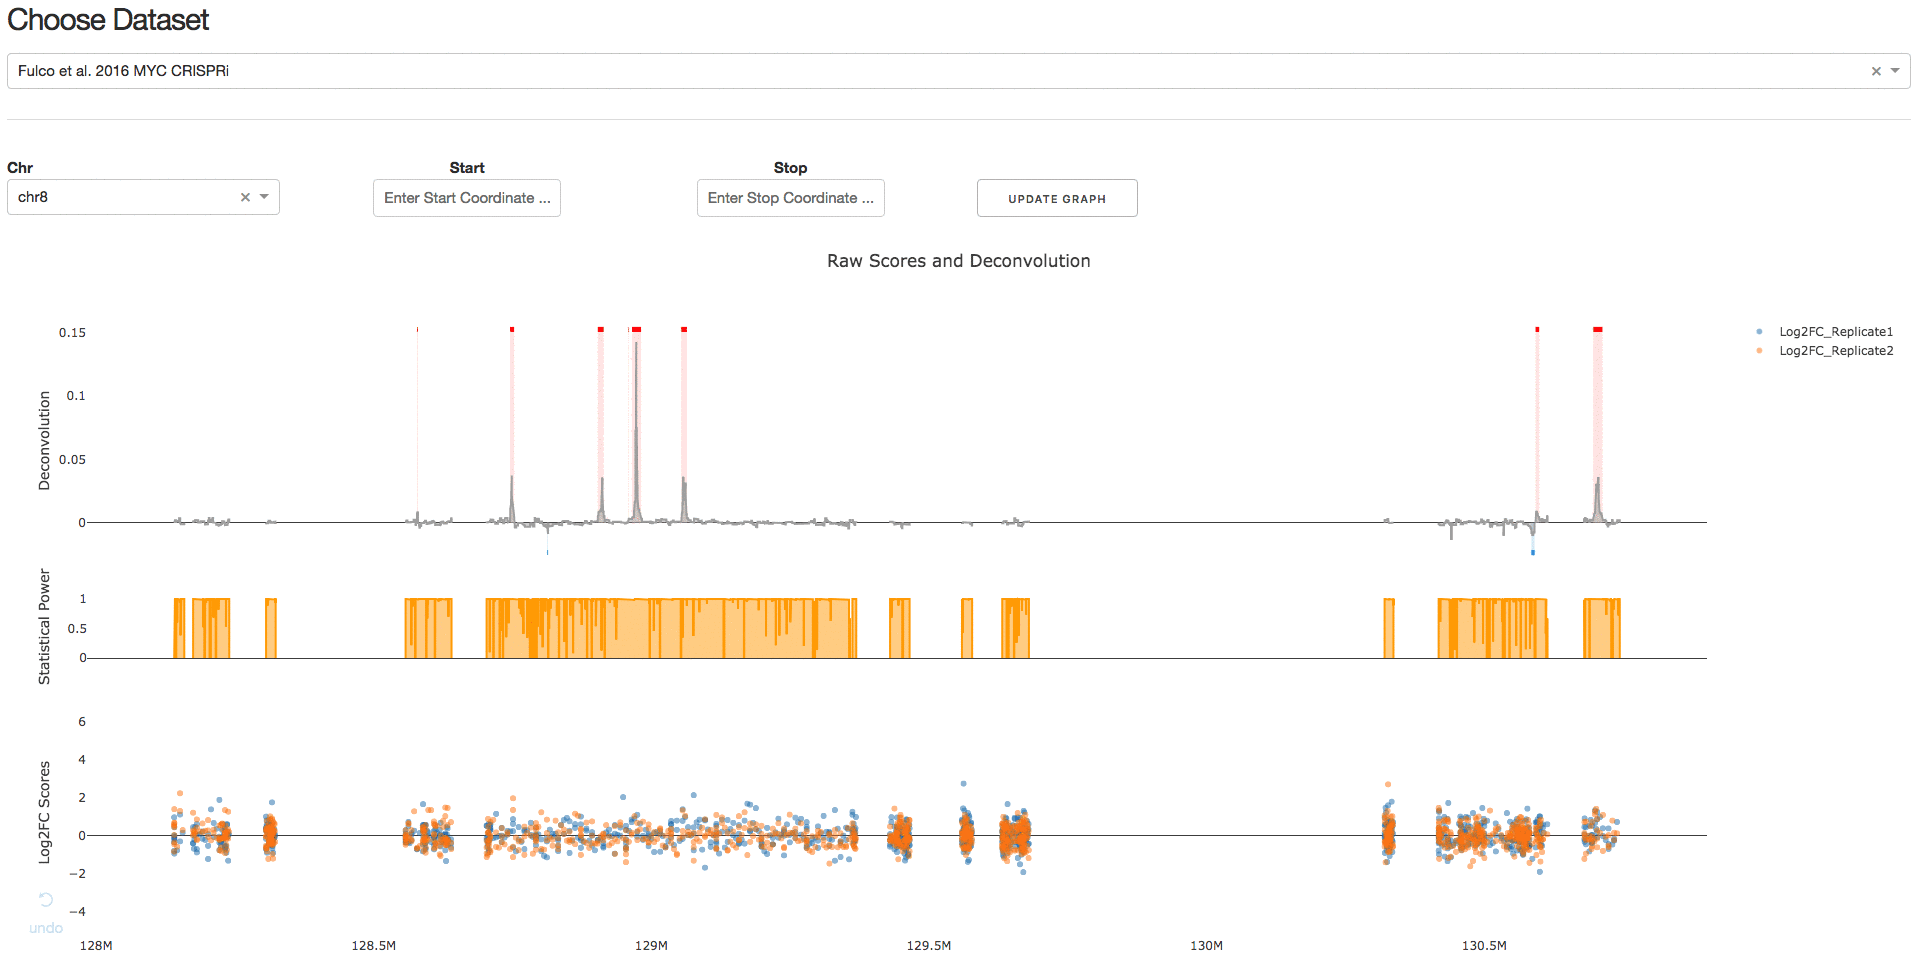
1. Choose Published Dataset
Under the tab Visualize Datasets, users can choose the dataset they are interested in visualizing from the drop-down menu.
2. Download IGV Session
Under the tab Download IGV Session, users can click on the Download IGV Session button to visualize the data on the IGV browser.
B) Design your own CRISPR tiling screen
1. Upload Regions and Set Parameters
Under the tab Upload Regions and Set Parameters, users can upload or input genomic regions of interest and set parameters related to the design of tiling sgRNAs (genome, PAM, sgRNA length, etc.). Multiple PAMs can be run in parallel (separated by spaces) and the formatting only allows for characters A, T, C, and G, where sets of bases or IUPAC codes can be indicated by brackets (i.e. N = [ATCG], V = [ACG], R = [AG]). Due to server capacity, there is a limitation of 1Mb for designing sgRNAs.
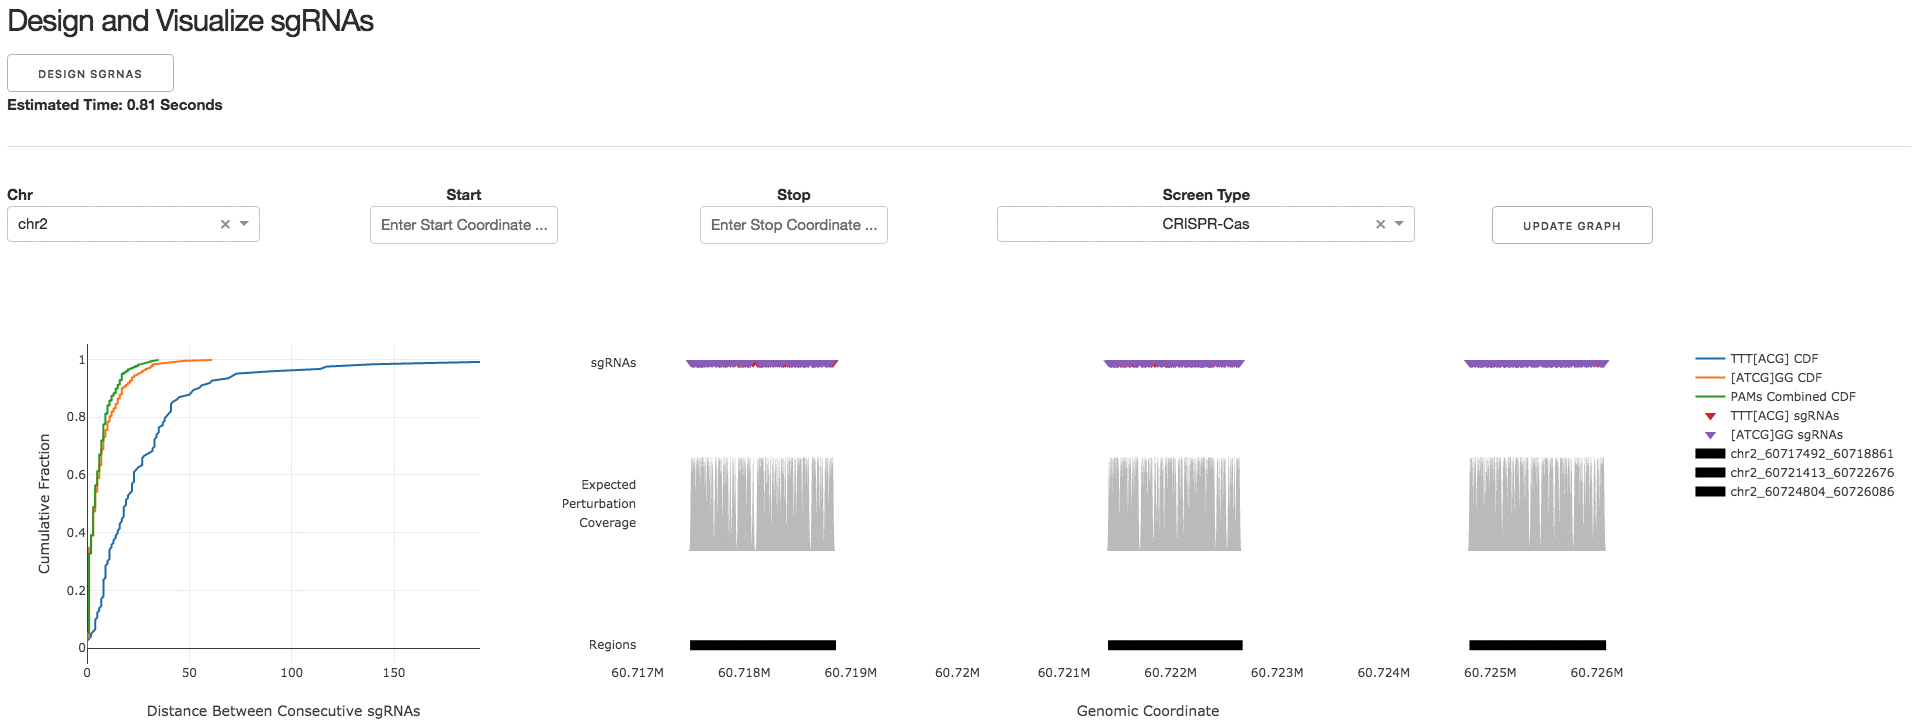
2. Design and Visualize sgRNAs
Under the tab Design and Visualize sgRNAs, users can click on the Design sgRNAs button to visualize the designed sgRNAs and tiling density statistics.
3. Download sgRNA Library
Under the tab Download sgRNA Library, users can click on the Download Files button to download a .CSV file containing information about the designed sgRNAs.
C) Analyze your CRISPR tiling screen data
1. Upload sgRNA Table
Under the tab Upload sgRNA Table, users can load example data, download example data, or upload their own data to be analyzed. Due to server capacity, the web-application can only process tiling screens with less than 10,000 sgRNAs. Please run CRISPR-SURF locally to analyze larger-scaled tiling screens.
The formatting for input data requires the exact column names:
- Chr: Chromosome
- Start: Genomic coordinate of sgRNA start
- Stop: Genomic coordinate sgRNA Start
- Perturbation_Index: Genomic coordinate of expected perturbation center (cleavage position for CRISPR-Cas, sgRNA center for CRISPRi/a, editing window for base-editors)
- sgRNA_Sequence: sgRNA sequence not including PAM sequence
- Strand: Targeting strand of sgRNA (+, -)
- sgRNA_Type: Type of sgRNA (observation, negative_control, positive_control)
- Log2FC_Replicate1: Replicate 1 Log2FC enrichment score of sgRNA
- Log2FC_Replicate2: Replicate 2 Log2FC enrichment score of sgRNA
IMPORTANT: Minimum of two experimental replicates are needed. Additional columns (Log2FC_ReplicateN) can be included for more experimental replicates.
NOTE: CRISPR-SURF Count, as described on our Github Page, can help convert raw FASTQs into the file format necessary for CRISPR-SURF deconvolution analysis.
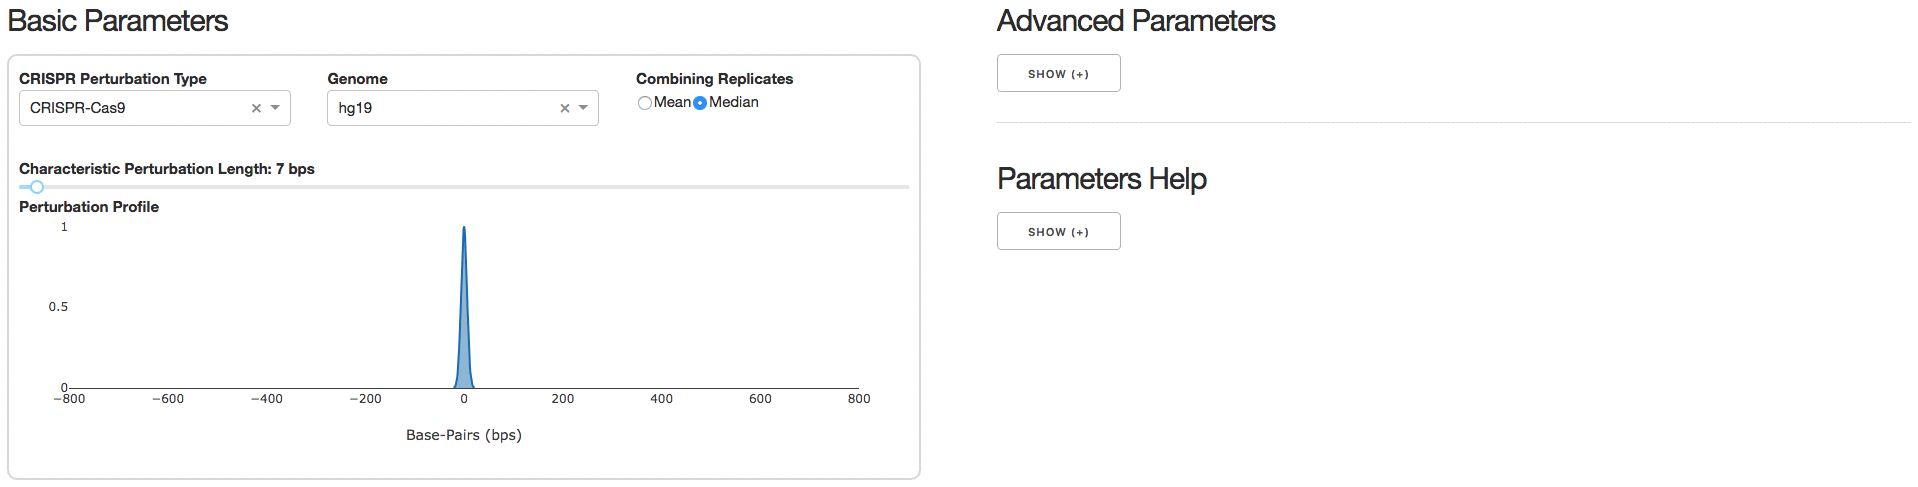
2. Analysis Parameters
Under the tab Analysis Parameters, users can specify parameters to be used for data analysis. Specifying the CRISPR Perturbation Type will lead to a default Characteristic Perturbation Length and Perturbation Profile, but this parameter can be further adjusted as seen below.
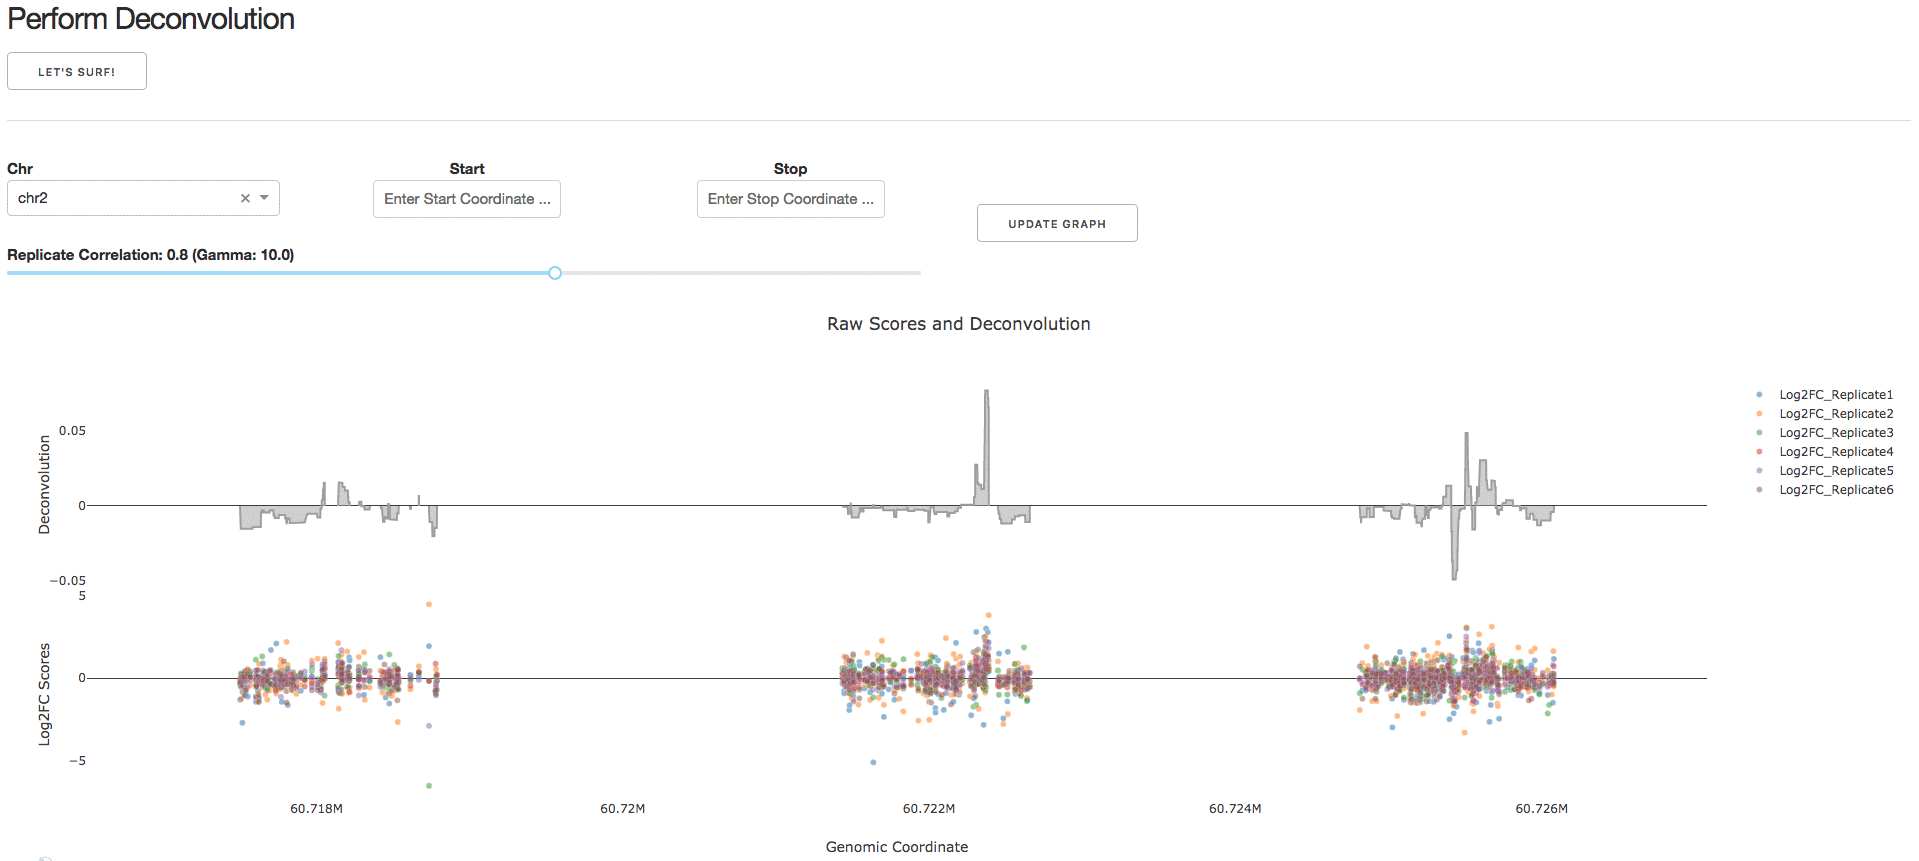
3. Perform Deconvolution
Under the tab Perform Deconvolution, users can perform deconvolution analysis on their CRISPR tiling screen data.
NOTE: Guidelines for choosing a reasonable regularization parameter (lambda) are presented in Supplementary Note 1. We strongly recommend using the default lambda value.
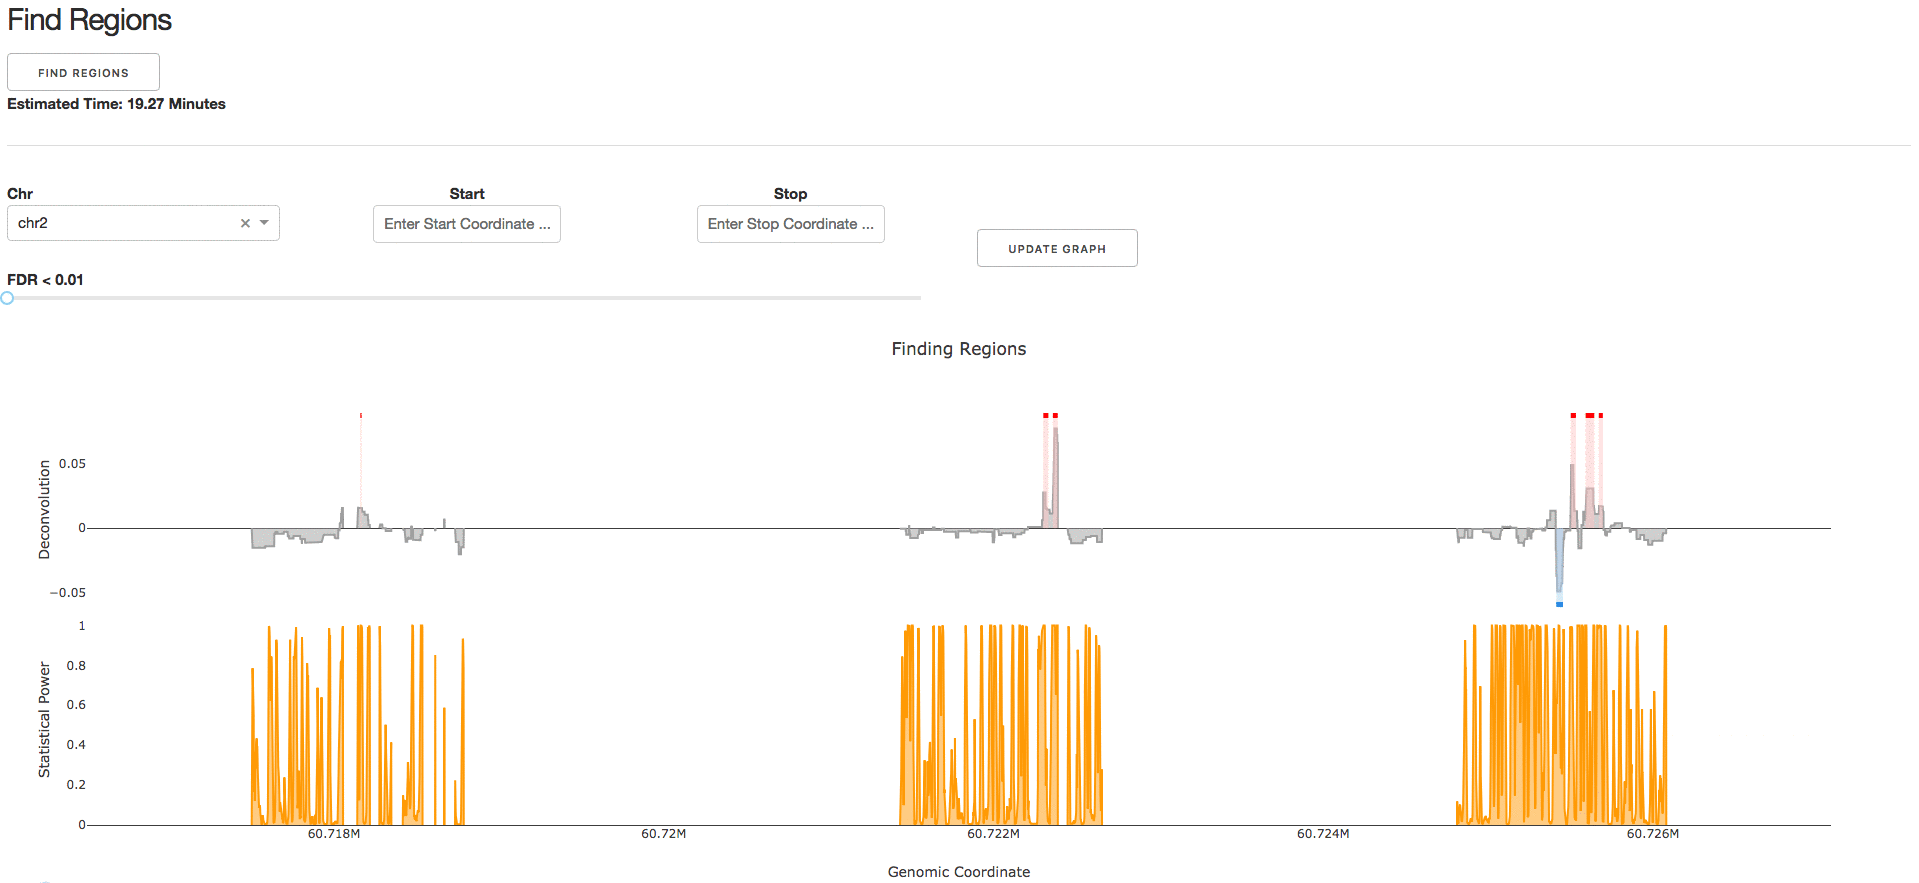
4. Find Regions
Under the tab Find Regions, users can perform statistical analysis on their deconvolved genomic regulatory signal.
NOTE: We strongly recommend the parameter Number of Simulations to be >1000 to ensure a null distribution with reasonable sample size.
5. Download Results
Under the tab Download Results, users can download the results from their CRISPR-SURF analysis. The following files are available:
- sgRNAs_summary_table_updated.csv: An updated sgRNAs summary table with deconvolution and p-adj. values
- igv_session.xml: An IGV session for the following tracks
- raw_scores.bedgraph: sgRNA enrichment scores
- deconvolved_scores.bedgraph: deconvolution beta profile
- positive_significant_regions.bed: positive significant regions at set FDR
- negative_significant_regions.bed: negative significant regions at set FDR
- neglog10_pvals.bedgraph: negative log10 p-values for betas
- statistical_power.bedgraph: statistical power track at set effect size and FDR
- significant_regions.csv: List of the significant regions and its associated statistics and supporting sgRNAs
- beta_profile.csv: Full deconvolution beta profile with associated statistics
- correlation_curve_lambda.csv: The correlation curve generated for determining lambda
- crispr-surf_parameters.csv: The CRISPR-SURF analysis parameters used during the analysis session
- crispr-surf.log: The log file for CRISPR-SURF analysis